Data. Facts. Figures.
To provide you, as an investor or bond interested party, with comprehensive information, our online archive offers downloads of PCC Group Annual Reports since 2003, PCC Group Quarterly Reports since 2001, and PCC Group Interim Financial Statements since 2022. The following tables provide you with an overview of the key figures for the PCC Group and PCC SE.
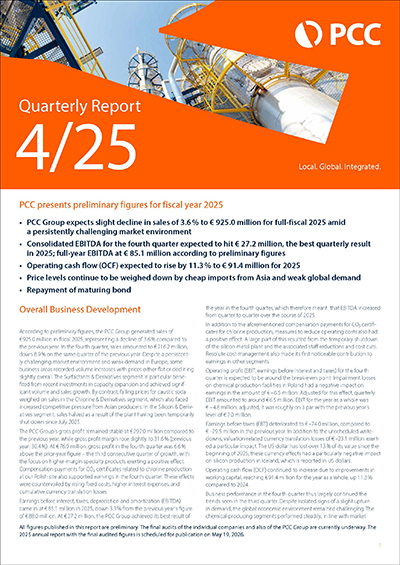
PCC Group Quarterly Report 4/2025
PCC SE Online Annual Report 2024:

PCC SE Annual Report
2024 (PDF 11MB):

Key Financials of the PCC Group and PCC SE
| Key figures PCC Group (in accordance with IFRS) | 2025* | 2024** | 2023** |
|---|---|---|---|
| Sales revenue (€ million) | 925.0 | 960.0 | 993.6 |
| Gross profit (€ million) | 292.0 | 292.4 | 307.3 |
| EBITDA (€ million) | 85.1 | 88.0 | 112.3 |
| EBIT (€ million) | -4.8 | 1.9 | 33.4 |
| EBT (€ million) | -59.2 | -29.5 | -20.8 |
| Consolidated result (€ million) | -69.6 | -48.0 | -25.0 |
| Total comprehensive income (€ million) | -*** | -37.1 | -1.7 |
| Operating cash flow (Mio. €) | 91,4 | 82,1 | 157,7 |
| Investments (€ million) | 167.8 | 126.5 | 142.5 |
| Key figures PCC Group (in accordance with IFRS) | 31.12.2025* | 31.12.2024** | 31.12.2023** |
|---|---|---|---|
| Net debt / EBITDA | 11.5 | 9.8 | 6.9 |
| Group equity (€ million) | 255.8 | 343.1 | 389.4 |
| Equity ratio (%) | 16.1 | 21.4 | 24.5 |
| Employees | 3,124 | 3,295 | 3,265 |
Rounding differences may occur.
* Preliminary figures
** The key figures as of December 31 have been taken from the audited consolidated financial statements of the PCC Group prepared in accordance with IFRS and issued with an unqualified audit opinion.
*** Group comprehensive income is calculated annually.
| PCC SE Key Figures (according to IFRS) | 2024* | 2023* | 2022* |
|---|---|---|---|
| EBT (€ million) | -11.2 | 24.6 | 8.1 |
| Net Loss/Profit (€ million) | -12.2 | 22.6 | 8.3 |
| Equity Ratio (%) | 56.0 | 60.2 | 60.6 |
| Total Assets (€ million) | 1,175.5 | 1,476.1 | 1,321.9 |
| Fair Value of Investment Portfolio (€ million) | 980.4 | 1,198.6 | 1,124.2 |
| - Market Value of All Listed Investments (€ million) ** | 348.1 | 471.0 | 443.7 |
| Investment Portfolio (Number) | 68 | 66 | 67 |
| Net Financial Liabilities (Million €) | 493.1 | 525.2 | 490.8 |
| Investments (Million €) | 5.4 | 22.4 | 20.8 |
| Employees (as of 31.12.) | 76 | 72 | 74 |
Rounding differences may occur.
* Key financials taken from audited separate financial statements of PCC SE prepared in accordance with IFRS and issued with unqualified audit opinions.
Downloads
Quarterly reports
Interim Consolidated Financial Statements
The download file was replaced on September 25, 2025, with a corrected version due to an inaccuracy on page 2.